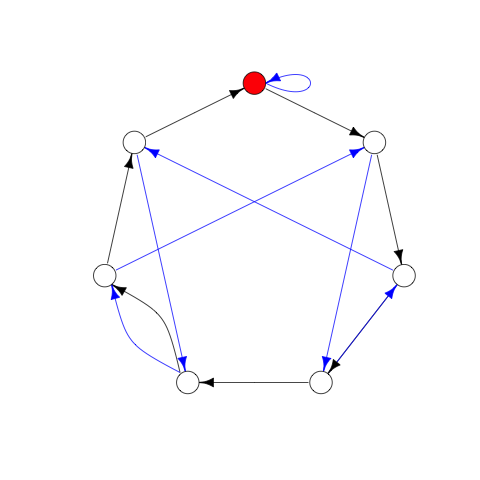
Check out this diagram that can be used to check if a number is divisible by 7:
What you do is this: Start at the red circle. For each digit in your number, starting with the left-most, you follow that many black arrows. Between each digit, follow a single blue arrow. If you end on the red circle, the number is divisible by 7, otherwise it’s not. For example, if your number was 245, you would follow 2 black arrows, one blue, 4 black, one blue, and finally 5 black. You end up back on the red circle, so 245 is divisible by 7.
Seems like magic at first, but it’s actually pretty simple. Each vertex represents the remainder when dividing by 7. The red circle is remainder 0, and they go up by one moving clockwise. Black arrows represent what happens to that remainder when you add 1, and blue arrows represent what happens to the remainder when you multiply by 10. Then moving along the arrows is essentially “building” the number up from 0 by a sequence of +1’s and x10’s.
Figuring out where the arrows go is then just a matter of figuring out what happens to the remainder after each operation. Adding one is obvious; you just add one to the remainder and remember that it might go back to 0. And multiplying by 10 can be calculated without too much trouble:
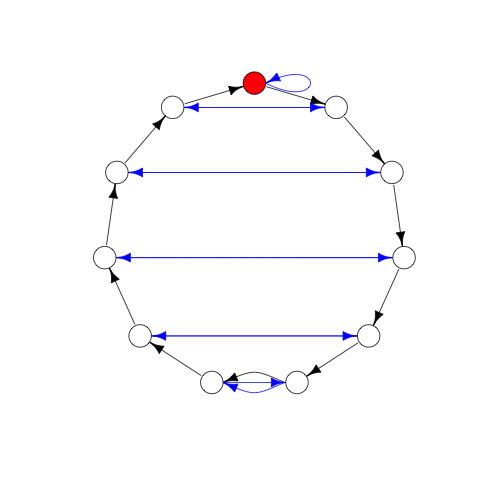
And so on. In fact, it’s pretty easy to make one of these diagrams to check for divisibility by any number. Here’s one for 11:
Here’s a zip file with 2 through 30 (they get pretty hard to read after that):
And here’s the R code I used to generate these:
library(igraph)

incr.edges <- function(n) {
	lapply(0:(n-1), function(x) {
		c(x, (x+1) %% n) + 1
	})
}

mult.edges <- function(n) {
	lapply(0:(n-1), function(x) {
		c(x, (10*x) %% n) + 1
	})
}

vertex.coords <- function(n) {
	t(
		sapply(0:(n-1), function(x) {
			c(sin(x * 2 * pi / n), cos(x * 2 * pi / n))
		})
	)
}

edge.colors <- function(n) {
	c(rep("black", n), rep("blue", n))
}

vertex.colors <- function(n) {
	c("red", rep("white", n-1))
}

plot.magic.circle <- function(n) {
	all.edges <- unlist(c(incr.edges(n), mult.edges(n)))
	plot(graph(all.edges),
		edge.color=edge.colors(n),
		vertex.color=vertex.colors(n),
		vertex.label=NA,
		layout=vertex.coords(n))
}

for(n in 2:30) {
	png(sprintf("~/Desktop/magic%i.png",n), bg="transparent")
	plot.magic.circle(n)
	dev.off()
}

